Sales Summary
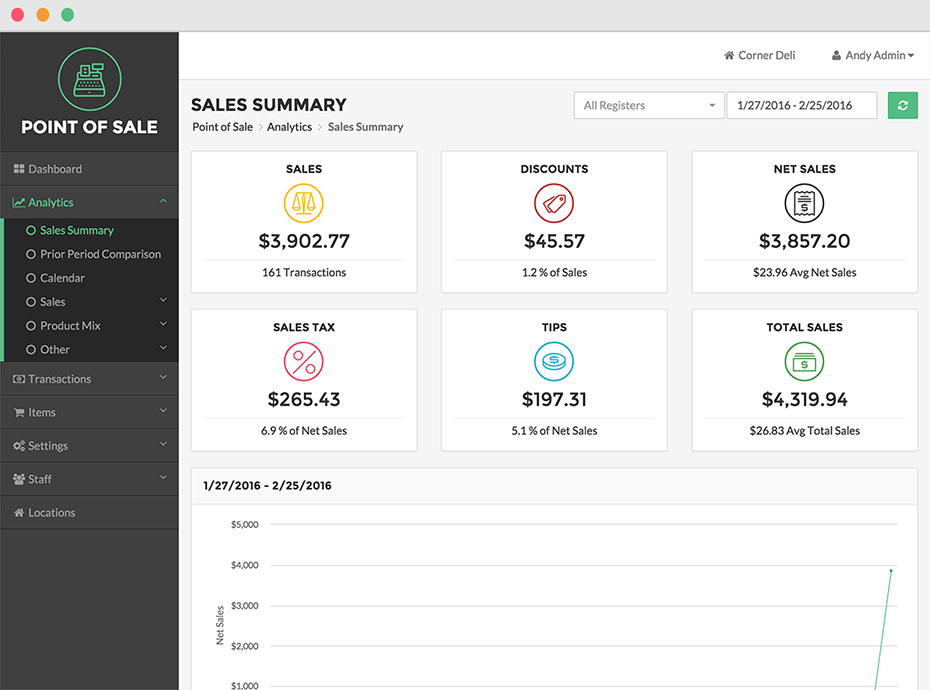
The Sales Summary Page is located under Analytics in the Navigation Menu. The Sales Summary Page displays a large amount of information according to the Date Range
To sort the information by Date Range, click the Date Drop Down in the upper right hand corner of the screen and select the time frame you wish to view. If you select Custom Range, select a Date Range using the calendar.

Note
If your business has multiple Locations, sort the information by Location, by clicking a Location in Location Drop Down Menu at the topmost right side of the screen.
The selected Date Range
Sales
The Sales Panel represents the sum of all the prices of goods and services purchased and the number of transactions comprising that sum.
Discounts
The Discounts Panel displays the total dollar amount of Discounts applied, and the percentage of Sales that the Discount total represents.
Net Sales
The Net Sales Panel displays the Sales made minus Discounts applied and the average Net Sale amount.
Sales Tax
The Sales Tax Panel represents the total amount of Sales Tax paid, and the percentage of that amount compared to Net Sales.
Tips
The Tips Panel displays the total amount of credit card tips received, and the percentage of that amount compared to Net Sales.
Total Sales
The Total Sales Panel represents the Net Sales total, minus Sales Tax, minus Tips paid.
Charts
The Sales Summary Page displays three primary charts that measure revenue. The first chart adjusts according to the Date Range you have selected and illustrates revenue throughout the selected Date Range. The Day of the Week Chart analyzes revenue, sorted by the day of week, within the Date Range you have selected. The Time of Day Chart displays average revenue performance throughout the time of day within the selected Date Range.
Concept Information